
Which Cedar Conductivity Value Should You Use?
The six-species table spans 0.094-0.14 W/(m·K) at the same nominal 12% moisture condition, so species matters when selecting an input.
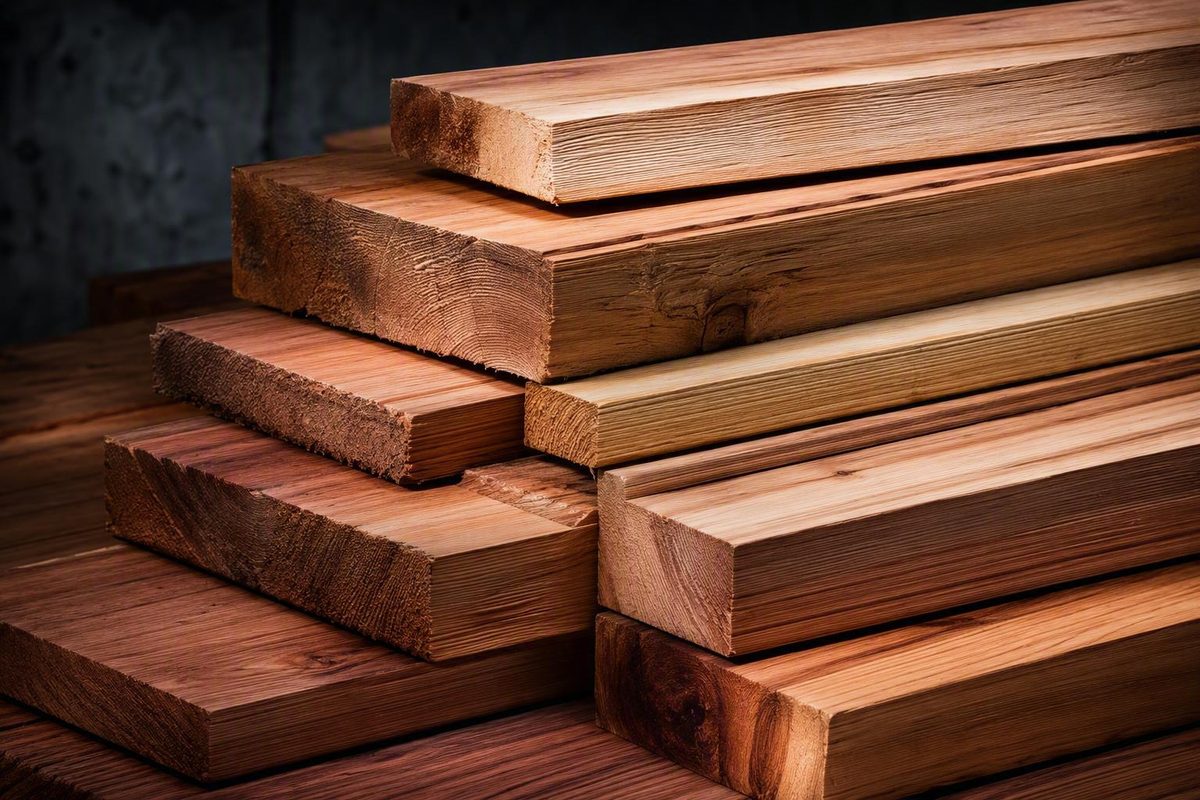
Quick answer: cedar is approximately 0.08–0.14 W/(m·K)
Cedar does not have one universal thermal-conductivity value. Across six commonly listed species, representative values range from approximately 0.079 to 0.11 W/(m·K) when ovendry and from 0.094 to 0.14 W/(m·K) at 12% moisture content. AmesWeb describes 12% moisture content as an approximation of typical air-dry service conditions and attributes its table to the USDA Forest Products Laboratory’s 2010 Wood Handbook; the handbook table was not independently reviewed for this article.1
Cedar thermal conductivity: compact answer
The unit W/(m·K)—watts per metre-kelvin—is the SI unit of thermal conductivity. It describes a material’s capacity to conduct heat under a temperature gradient. With thickness, area, temperature difference, and other conditions held comparable, a lower conductivity means less heat is conducted through the material.
For preliminary work involving approximately air-dry Western red cedar, 0.10–0.11 W/(m·K) is a reasonable qualified range.14 If a model requires one rounded screening input, 0.11 W/(m·K) may be used only when it is labeled clearly as an approximate value for Western red cedar—not for cedar generally.
The complete 0.079–0.14 W/(m·K) span combines different species and moisture conditions; it is not a tolerance band for every cedar board.1 For engineering, procurement, compliance, or other consequential decisions, use condition-matched product data rather than treating the broad range as a guaranteed material property.
Cedar conductivity by species and moisture content
The species name materially changes the lookup value.
The table below provides representative room-temperature guidance. Its publisher attributes the underlying figures to the USDA Forest Products Laboratory’s 2010 Wood Handbook and warns that they are approximate rather than guaranteed properties for every specimen.1
| Species | Ovendry conductivity, W/(m·K) | Conductivity at 12% moisture, W/(m·K) |
|---|---|---|
| Atlantic white cedar | 0.085 | 0.10 |
| Eastern red cedar | 0.11 | 0.14 |
| Northern white cedar | 0.079 | 0.094 |
| Port-Orford cedar | 0.10 | 0.12 |
| Western red cedar | 0.083 | 0.10 |
| Yellow cedar | 0.11 | 0.13 |
Source and qualification: representative AmesWeb room-temperature values attributed there to the USDA Forest Products Laboratory’s 2010 Wood Handbook; the original handbook table was not independently verified here.1
Northern white cedar has the lowest listed conductivity under both conditions, at 0.079 W/(m·K) ovendry and 0.094 W/(m·K) at 12% moisture. Eastern red cedar has the highest listed value at 12% moisture, 0.14 W/(m·K).1
Moisture raises every value in the table, but it does not eliminate the differences among species. At the same nominal 12% moisture condition, substituting Eastern red cedar for Northern white cedar merely because both include “cedar” in the name would conceal a meaningful difference in the heat-transfer input.
The table also shows why the conditioning basis must accompany the number. Western red cedar is listed at 0.083 W/(m·K) when ovendry and 0.10 W/(m·K) at 12% moisture.1 Quoting either number without its moisture basis makes the value ambiguous.
Ovendry is a controlled reference state, not a default description of wood in ordinary service. Wood exchanges moisture with its surroundings, so an ovendry value should not be inserted into a model as though it represented air-dry, exterior, damp, or intermittently wet cedar.
For early comparisons, the table offers a consistent set of representative values. For a product specification, however, “cedar: 0.10 W/(m·K)” remains incomplete. At minimum, identify the species and moisture condition. Where known, also record product form, temperature, density, grain orientation, and test basis.
Why published cedar values differ
Differences among published cedar values do not necessarily mean that one source is wrong. Conductivity depends on what was tested, how it was conditioned, the direction of heat flow, and how the result was measured or reported.
Species. The six-species table spans 0.094–0.14 W/(m·K) at the same nominal 12% moisture condition.1 Different wood structures and typical densities contribute to the variation. A generic cedar label discards that information.
Moisture content. Wood has a cellular network containing cavities that may hold air or water. Trapped air helps account for wood’s relatively low conductivity. As moisture content rises, more-conductive water replaces some of that air and provides additional heat-transfer paths, so conductivity generally increases.
A USDA Forest Products Laboratory literature review identifies moisture content as a significant influence on thermal-property test results and recognizes that physical properties may vary considerably even within one species. The report reviewed existing evidence rather than performing new cedar measurements, but it helps explain why precise-looking lookup values still require qualification.5
Density. A greater proportion of solid wood substance generally provides more paths for energy conduction, while lower-density material ordinarily contains more air-filled space. Density can vary with species, growth conditions, position within the tree, and individual specimen. A species-average conductivity therefore need not describe every board.
Temperature. Conductivity is not necessarily fixed across all operating temperatures. The measured shingle data discussed below show a modest increase between 15°C and 45°C for those samples.2 The measurements demonstrate a temperature effect in the tested material, but they do not establish a universal cedar correction equation.
Grain orientation. Wood is anisotropic, meaning its properties vary with direction. ThermalFinn states that wood can conduct heat roughly 2–2.5 times faster along the grain than across it.4 This is not a cedar-specific correction factor, and many published cedar entries do not identify the direction of heat flow.
That omission matters. When the orientation behind a reference value is unknown, treat the number as a comparison or preliminary estimate rather than an exact constant.
Natural variation. Trees are biological materials. AmesWeb warns that actual conductivity may differ from its representative values by as much as approximately 20%.1 That warning is not an instruction to add or subtract 20% mechanically in every calculation; it indicates that a tabulated average is not a guaranteed product property.
Test method. It is important to distinguish a direct measurement from a representative table entry or unit conversion.
Product form. Shingle measurements should remain labeled as shingle data rather than being merged silently into a lumber table.
These variables also explain why 0.10 and 0.107 W/(m·K) should not automatically be presented as contradictory Western red cedar values.13 The available evidence does not establish whether their difference results from rounding, underlying data, specimen variation, or test conditions. Assigning it to one cause would be speculation.
What measured cedar-shingle data show
Measured cedar-shingle results provide a useful product-specific example, but they should remain separate from the species table. The FSRI Materials and Products Database identifies the tested material only as cedar shingle; it does not name the species.2
The samples were tested with a heat-flow meter in dried and unconditioned states:
| Conditioning state | Temperature | Conductivity, W/(m·K) | Reported standard deviation, W/(m·K) |
|---|---|---|---|
| Dried | 15°C | 0.075 | 0.002 |
| Dried | 45°C | 0.080 | 0.002 |
| Unconditioned | 15°C | 0.084 | 0.002 |
| Unconditioned | 45°C | 0.089 | 0.002 |
Source: FSRI heat-flow-meter measurements for cedar-shingle samples.2
For these samples, drying reduced measured conductivity by 0.009 W/(m·K) at both temperatures: from 0.084 to 0.075 W/(m·K) at 15°C and from 0.089 to 0.080 W/(m·K) at 45°C. Conductivity also increased by 0.005 W/(m·K) between 15°C and 45°C in both conditioning states.2
Those equal differences make the dataset easy to interpret, but they are not universal correction factors. The evidence does not justify subtracting 0.009 W/(m·K) whenever cedar dries or adding 0.005 W/(m·K) whenever its temperature rises by 30°C.2 The changes apply to the tested samples under the reported conditions.
Several details needed for broader application are absent from the supplied database entry:
- Cedar species
- Quantified moisture content of the unconditioned samples
- Grain direction relative to heat flow
- Density
- Other specimen information needed for direct comparison with lumber tables
The measured 0.075–0.089 W/(m·K) span therefore is not a universal range for dry cedar or cedar shingles.2 Nor does it contradict the representative lumber values. The datasets concern different product forms and conditioning arrangements, with insufficient information for a direct like-for-like comparison.
The shingle results are most relevant when a project uses a similar product and its temperature and conditioning state align reasonably with the test. Even then, disclose that the species is unspecified and that “unconditioned” was not assigned a quantified moisture content.
Western red cedar: reconciling 0.10, 0.107, and 0.11 W/(m·K)
Western red cedar is associated with four related but differently qualified figures:
- 0.083 W/(m·K): representative ovendry value1
- 0.10 W/(m·K): representative value at 12% moisture content1
- Approximately 0.107 W/(m·K): conversion of a separately published imperial value at 12% moisture content3
The first two figures come from the representative species table. Their different moisture bases are essential: the ovendry number is not an interchangeable substitute for the 12%-moisture value.
Cedar Country Lumber reports Western red cedar conductivity as 0.74 BTU·in/(ft²·h·°F) at 12% moisture content. Converting that figure gives approximately 0.107 W/(m·K).3 This is a unit conversion, not a directly reported SI laboratory measurement. The page does not provide a test method, temperature, grain orientation, uncertainty, or specimen details, so the result remains a qualified reference.
The same page contains an incorrect parenthetical equivalence implying that one inch is approximately 34 mm. The correct dimensional conversion is 1 inch = 25.4 mm.3 Calculations for a one-inch board should therefore use 0.0254 m, not 0.034 m.
ThermalFinn separately lists 0.11 W/(m·K) for Western red cedar but does not identify the experimental source or specify the associated moisture content, temperature, method, grain direction, or uncertainty in the supplied material.4 It is therefore most defensible as a rounded screening figure, not evidence that every Western red cedar product has that exact conductivity.
For preliminary calculations near air-dry conditions, these references support a practical Western red cedar range of approximately 0.10–0.11 W/(m·K).134 This range does not establish that the three figures originated from the same test. Their small differences could reflect rounding, different source data, test conditions, or specimen variation; the evidence does not resolve the cause.
Accordingly:
- Use 0.10 W/(m·K) when following the representative 12%-moisture species table.1
- Use 0.107 W/(m·K) only when identifying it as a conversion of the published imperial value.3
- Use 0.11 W/(m·K) as a rounded preliminary input only when labeled “approximate Western red cedar.”4
None of these figures should be represented as a guaranteed design property without applicable product documentation.
Converting conductivity into material thermal resistance
For a uniform material layer of known thickness, SI material resistance can be estimated with:
R = d ÷ k
where:
- R = material thermal resistance in m²·K/W
- d = material thickness in metres
- k = thermal conductivity in W/(m·K)
Consider a Western red cedar board 25.4 mm, or 0.0254 m, thick.3
Using the representative 12%-moisture value of 0.10 W/(m·K):1
R = 0.0254 ÷ 0.10 = 0.254 m²·K/W
Using the separately converted reference of 0.107 W/(m·K):3
R = 0.0254 ÷ 0.107 ≈ 0.237 m²·K/W
The calculated difference is approximately 0.017 m²·K/W. This illustrates why a calculation should report its conductivity input and assumptions rather than presenting only the resulting resistance.
Both results are material-only estimates. The first follows a representative species-table input; the second uses a value converted from an incompletely documented imperial reference. Neither calculation turns that input into a tested assembly rating.
A complete wall, roof, or cladding assembly may also include:
- Board joints and gaps
- Framing or furring
- Mechanical fasteners
- Insulation and sheathing
- Interior and exterior air films
- Cavities and ventilation
- Thermal bridges
- Parallel and series heat-flow paths
Those features are not represented by R=d/k for the cedar layer alone. The calculation can support material comparison or preliminary heat-flow modelling, but it is not the tested R-value of a complete assembly, proof of code compliance, or a prediction of whole-building energy performance.
Dimensional accuracy matters as well. A one-inch thickness must be entered as 0.0254 m.3 Using 0.034 m because of the incorrect equivalence on the supplier page would overstate the estimated material resistance.
How to choose a cedar value for calculations
Choosing a defensible conductivity is less about finding the most precise-looking decimal and more about matching the input to the proposed material and service conditions.
1. Identify the species. Determine whether the product is Western red cedar, Northern white cedar, Eastern red cedar, yellow cedar, Port-Orford cedar, Atlantic white cedar, or another wood sold under a cedar name. If the species is unknown, retain a range instead of selecting an unsupported midpoint.
2. Identify the product form. Record whether the material is solid lumber, siding, a shingle, a shake, a panel, a laminated component, or a modified product. Measurements from one form should not be assumed to transfer unchanged to another.
3. Establish the service moisture condition. Decide whether the model represents an ovendry laboratory state, approximately air-dry service, a controlled interior, or a wetter exposure. Ovendry figures should not be used as though they represented normal or wet service conditions.
For unspecified cedar near 12% moisture, retain 0.094–0.14 W/(m·K) until the species is known.1 Choosing the midpoint may simplify a spreadsheet, but it creates precision that the material description does not support.
4. Establish the expected temperature. A room-temperature value may not remain equally representative at substantially different temperatures. Where the application has an unusual operating range, seek data covering that range rather than assuming temperature independence.
5. Determine heat-flow direction relative to grain. Identify whether heat travels mainly along or across the wood fibres. If the reference does not state grain direction, record that uncertainty instead of applying an unsupported orientation correction.
6. Look for an applicable product test. Manufacturer or laboratory data should match the actual species, product construction, moisture condition, density, temperature range, heat-flow direction, and test method as closely as possible. This becomes particularly important when the value affects engineering decisions, contractual performance, or compliance work. The USDA literature review explains why moisture, density, test conditions, measurement error, and within-species variation limit the precision of a generic wood constant.5
For preliminary Western red cedar calculations near air-dry conditions, use approximately 0.10–0.11 W/(m·K) and label it as representative.134 If one rounded input is unavoidable, 0.11 W/(m·K) may be used with the adjacent note “approximate Western red cedar, near air-dry conditions.”
For cedar shingles, the measured 0.075–0.089 W/(m·K) results may be relevant where the tested conditioning states and temperatures align with the intended use.2 Retain the limitations: unspecified species, unquantified moisture in the unconditioned state, and missing grain-direction and density information.
Whatever value is selected, document:
- Conductivity and units
- Species
- Moisture content or conditioning state
- Temperature
- Product form
- Density, if known
- Grain direction, if known
- Test method
- Source
- Whether the figure is measured, representative, rounded, calculated, or converted
| Application | Suggested preliminary approach | Essential qualification |
|---|---|---|
| Western red cedar near air-dry conditions | Use approximately 0.10–0.11 W/(m·K)13 | Representative range, not a guaranteed property |
| Unspecified cedar near 12% moisture | Retain 0.094–0.14 W/(m·K)1 | Do not select a precise value until the species is known |
| Cedar shingle similar to tested samples | Consider 0.075–0.089 W/(m·K) where temperature and conditioning match2 | Species and several specimen details are unknown |
| Project-specific engineering analysis | Use applicable product-test data | Match moisture, temperature, density, orientation, form, and method |
The practical rule is simple: use about 0.10–0.11 W/(m·K) only as a qualified preliminary value for air-dry Western red cedar.13 When the species is unknown, retain the representative 0.094–0.14 W/(m·K) range at 12% moisture instead of inventing a precise midpoint.1 Before consequential engineering or compliance decisions, replace either estimate with condition-matched, product-specific test data.
Is cedar’s thermal conductivity always 0.11 W/(m·K)?
No. 0.11 W/(m·K) is a rounded secondary reference for Western red cedar with incompletely documented conditions.4 The representative species table includes cedar values both below and above that figure, so it is not a universal material constant.1
What is the thermal conductivity of Western red cedar at 12% moisture content?
The representative species table gives 0.10 W/(m·K) at 12% moisture.1 A separate imperial reference converts to approximately 0.107 W/(m·K).3 For preliminary work, these figures support a qualified air-dry Western red cedar range of about 0.10–0.11 W/(m·K).
Does moisture increase cedar’s thermal conductivity?
Generally, yes. Every cedar entry in the representative table is higher at 12% moisture than in the ovendry state.1 The tested cedar shingles likewise had higher conductivity when unconditioned than after drying, although the moisture content of the unconditioned samples was not quantified.2
The size of the increase should not be assumed to be identical for every species or product. Density, temperature, grain orientation, conditioning, and test method remain relevant.
Can cedar conductivity be used to calculate an R-value?
Yes, for a uniform material layer:
R = thickness in metres ÷ conductivity in W/(m·K)
The result is material resistance in m²·K/W. For example, a 25.4 mm board gives approximately 0.254 m²·K/W at 0.10 W/(m·K) or 0.237 m²·K/W at 0.107 W/(m·K).13 These are material-only estimates, not complete wall, roof, or cladding assembly ratings.
Why are measured cedar-shingle values lower than some Western red cedar reference values?
The datasets are not directly equivalent. The shingle measurements cover a particular product form and conditioning protocol, while the Western red cedar figures are species-level representative or converted secondary values. The shingle species, density, grain direction, and unconditioned moisture content were not supplied.2
Drying and test temperature affected the measured shingles, but the evidence does not isolate one cause for their difference from the Western red cedar references. The lower measurements should therefore remain sample-specific rather than being used to discredit the representative lumber values.
-
AmesWeb, “Thermal Conductivity of Hardwoods and Softwoods”, a representative engineering table that attributes its data to the USDA Forest Products Laboratory’s 2010 Wood Handbook. ↩↩↩↩↩↩↩↩↩↩↩↩↩↩↩↩↩↩↩↩↩↩↩↩↩↩↩↩
-
FSRI Materials and Products Database, “Cedar Shingle”. ↩↩↩↩↩↩↩↩↩↩
-
Cedar Country Lumber, “Thermal Conductivity of Cedar”. ↩↩↩↩↩↩↩↩↩↩↩↩↩↩↩
-
USDA Forest Products Laboratory, Thermal Properties of Wood and Wood Panel Products for Use in Buildings. ↩↩